We...
have data organised in an unideal way for our analysis
want to reorganise the data to carry on with our analysis
2 / 23
Data: Sales
We have...
## # A tibble: 2 × 4## customer_id item_1 item_2 item_3## <dbl> <chr> <chr> <chr> ## 1 1 bread milk banana## 2 2 milk toilet paper <NA>3 / 23
Data: Sales
We have...
## # A tibble: 2 × 4## customer_id item_1 item_2 item_3## <dbl> <chr> <chr> <chr> ## 1 1 bread milk banana## 2 2 milk toilet paper <NA>We want...
## # A tibble: 6 × 3## customer_id item_no item ## <dbl> <chr> <chr> ## 1 1 item_1 bread ## 2 1 item_2 milk ## 3 1 item_3 banana ## 4 2 item_1 milk ## 5 2 item_2 toilet paper## 6 2 item_3 <NA>3 / 23
A grammar of data tidying

The goal of tidyr is to help you tidy your data via
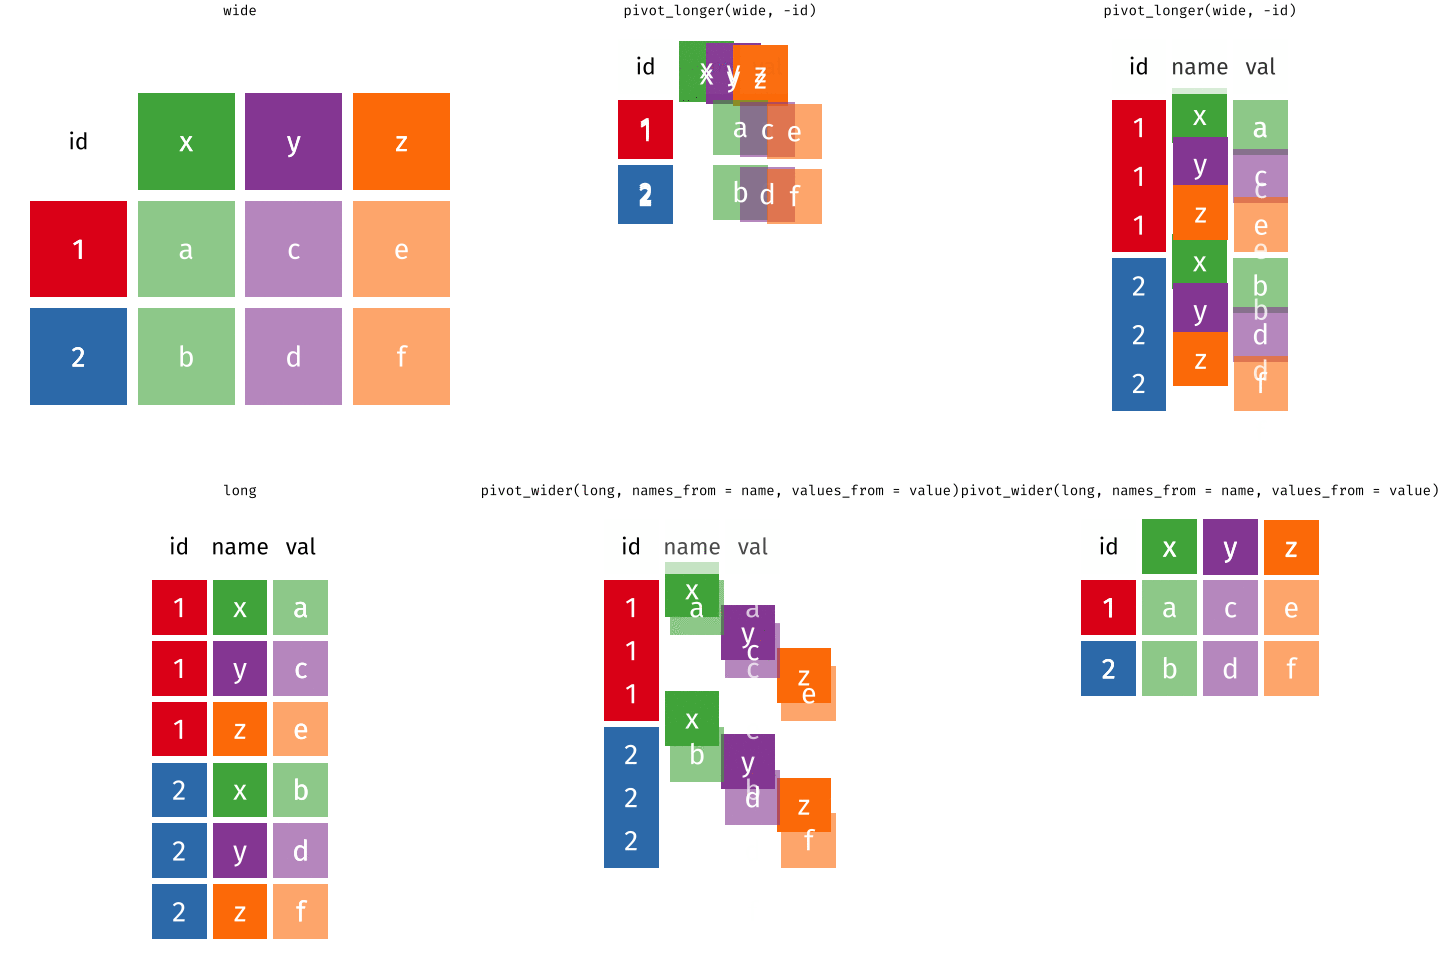
- pivoting for going between wide and long data
- splitting and combining character columns
- nesting and unnesting columns
- clarifying how
NAs should be treated
4 / 23
Wider vs. longer
wider
more columns
## # A tibble: 2 × 4## customer_id item_1 item_2 item_3## <dbl> <chr> <chr> <chr> ## 1 1 bread milk banana## 2 2 milk toilet paper <NA>8 / 23
Wider vs. longer
wider
more columns
## # A tibble: 2 × 4## customer_id item_1 item_2 item_3## <dbl> <chr> <chr> <chr> ## 1 1 bread milk banana## 2 2 milk toilet paper <NA>longer
more rows
## # A tibble: 6 × 3## customer_id item_no item ## <dbl> <chr> <chr> ## 1 1 item_1 bread ## 2 1 item_2 milk ## 3 1 item_3 banana ## 4 2 item_1 milk ## 5 2 item_2 toilet paper## 6 2 item_3 <NA>8 / 23
pivot_longer()
data(as usual)
pivot_longer( data, cols, names_to = "name", values_to = "value" )9 / 23
pivot_longer()
data(as usual)cols: columns to pivot into longer format
pivot_longer( data, cols, names_to = "name", values_to = "value" )10 / 23
pivot_longer()
data(as usual)cols: columns to pivot into longer formatnames_to: name of the column where column names of pivoted variables go (character string)
pivot_longer( data, cols, names_to = "name", values_to = "value" )11 / 23
pivot_longer()
data(as usual)cols: columns to pivot into longer formatnames_to: name of the column where column names of pivoted variables go (character string)values_to: name of the column where data in pivoted variables go (character string)
pivot_longer( data, cols, names_to = "name", values_to = "value" )12 / 23
Customers → purchases
purchases <- customers %>% pivot_longer( cols = item_1:item_3, # variables item_1 to item_3 names_to = "item_no", # column names -> new column called item_no values_to = "item" # values in columns -> new column called item )purchases## # A tibble: 6 × 3## customer_id item_no item ## <dbl> <chr> <chr> ## 1 1 item_1 bread ## 2 1 item_2 milk ## 3 1 item_3 banana ## 4 2 item_1 milk ## 5 2 item_2 toilet paper## 6 2 item_3 <NA>13 / 23
Why pivot?
Most likely, because the next step of your analysis needs it
prices## # A tibble: 5 × 2## item price## <chr> <dbl>## 1 avocado 0.5 ## 2 banana 0.15## 3 bread 1 ## 4 milk 0.8 ## 5 toilet paper 3purchases %>% left_join(prices)## # A tibble: 6 × 4## customer_id item_no item price## <dbl> <chr> <chr> <dbl>## 1 1 item_1 bread 1 ## 2 1 item_2 milk 0.8 ## 3 1 item_3 banana 0.15## 4 2 item_1 milk 0.8 ## 5 2 item_2 toilet paper 3 ## 6 2 item_3 <NA> NA14 / 23
Purchases → customers
data(as usual)names_from: which column in the long format contains the what should be column names in the wide formatvalues_from: which column in the long format contains the what should be values in the new columns in the wide format
purchases %>% pivot_wider( names_from = item_no, values_from = item )## # A tibble: 2 × 4## customer_id item_1 item_2 item_3## <dbl> <chr> <chr> <chr> ## 1 1 bread milk banana## 2 2 milk toilet paper <NA>15 / 23
Data
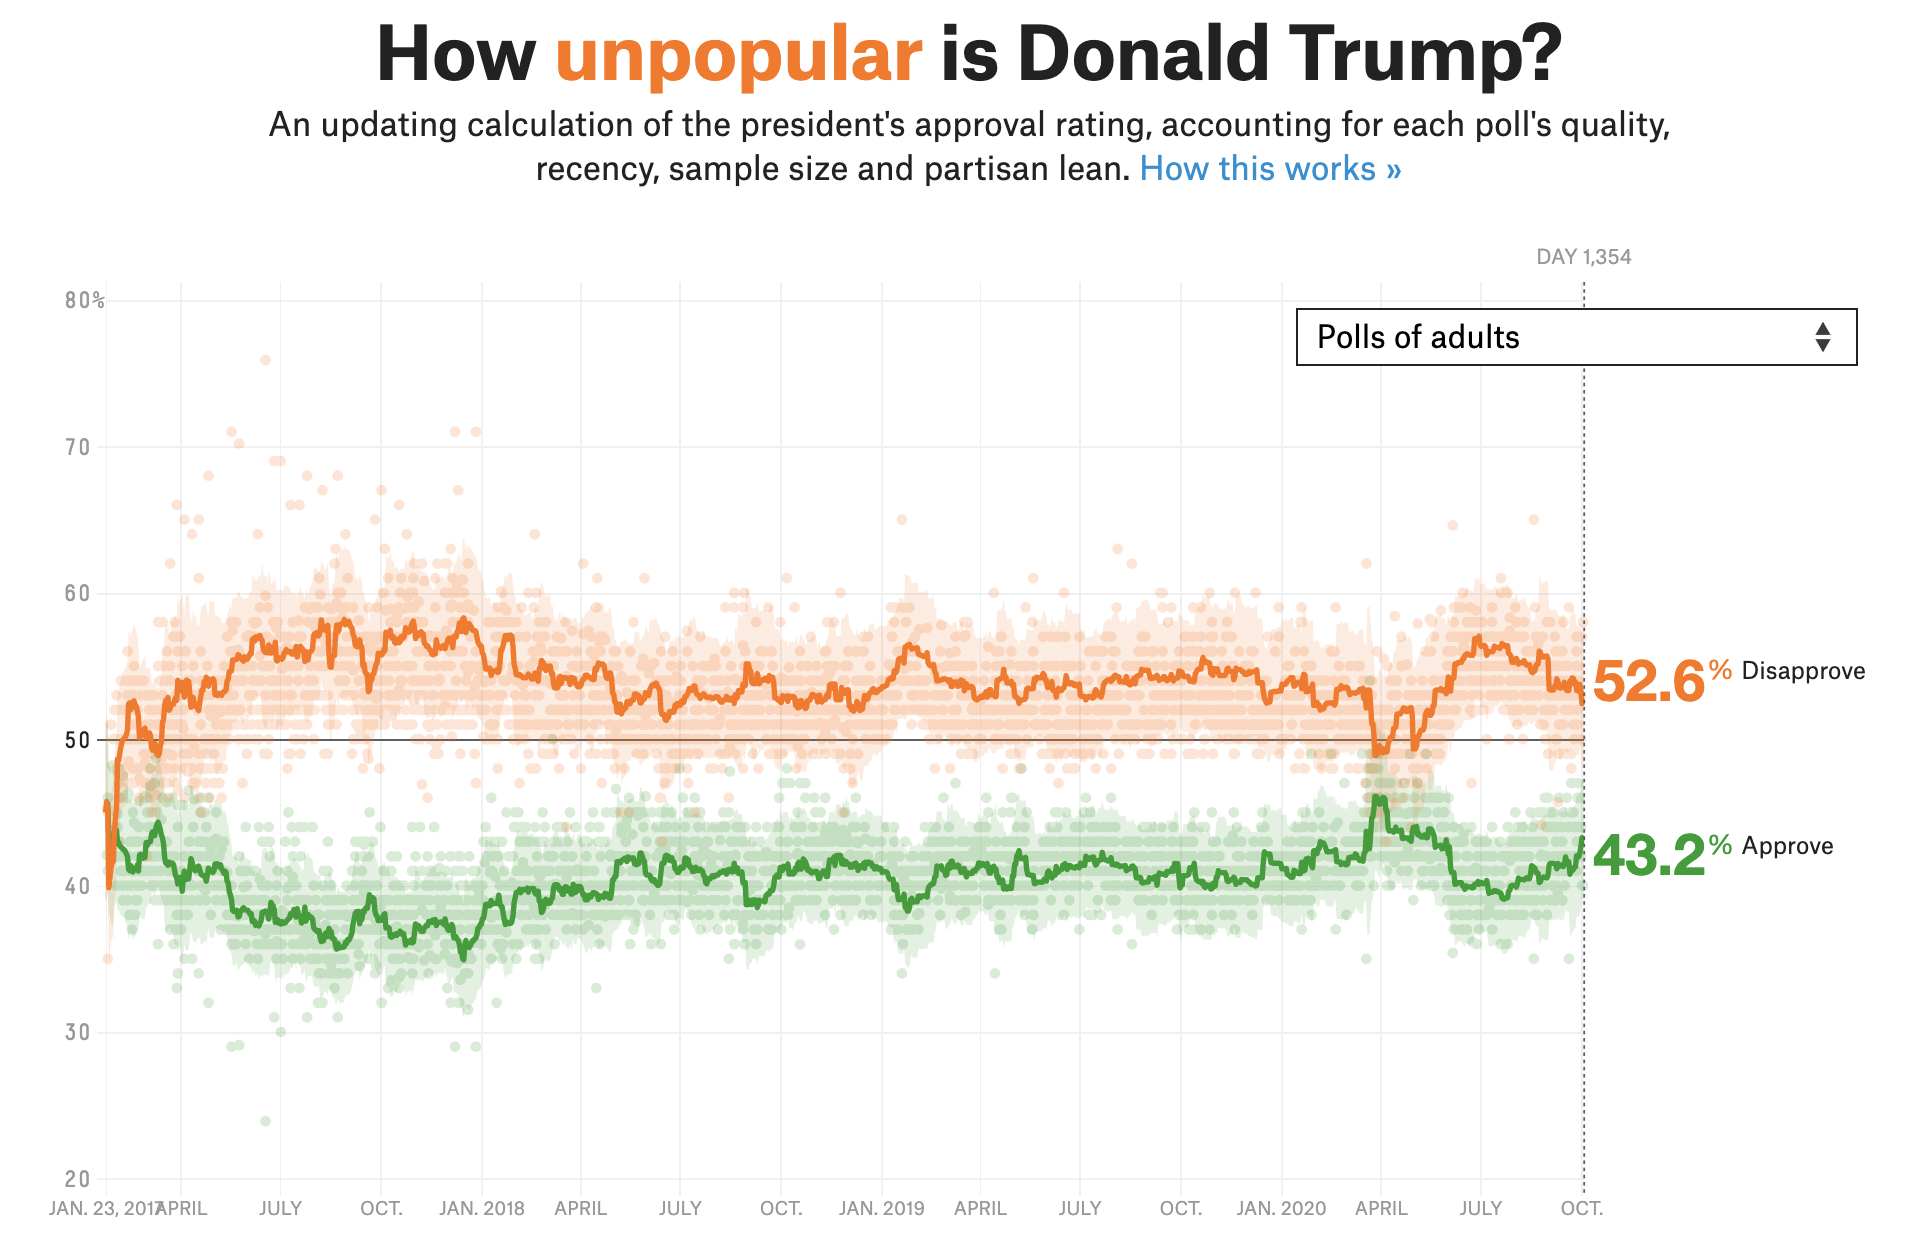
trump## # A tibble: 2,702 × 4## subgroup date approval disapproval## <chr> <date> <dbl> <dbl>## 1 Voters 2020-10-04 44.7 52.2## 2 Adults 2020-10-04 43.2 52.6## 3 Adults 2020-10-03 43.2 52.6## 4 Voters 2020-10-03 45.0 51.7## 5 Adults 2020-10-02 43.3 52.4## 6 Voters 2020-10-02 44.5 52.1## 7 Voters 2020-10-01 44.1 52.8## 8 Adults 2020-10-01 42.7 53.3## 9 Adults 2020-09-30 42.2 53.7## 10 Voters 2020-09-30 44.2 52.7## # … with 2,692 more rows18 / 23
Goal

Aesthetic mappings:
✅ x = date
❌ y = rating_value
❌ color = rating_type
Facet:
✅ subgroup (Adults and Voters)
19 / 23
Pivot
trump_longer <- trump %>% pivot_longer( cols = c(approval, disapproval), names_to = "rating_type", values_to = "rating_value" )trump_longer## # A tibble: 5,404 × 4## subgroup date rating_type rating_value## <chr> <date> <chr> <dbl>## 1 Voters 2020-10-04 approval 44.7## 2 Voters 2020-10-04 disapproval 52.2## 3 Adults 2020-10-04 approval 43.2## 4 Adults 2020-10-04 disapproval 52.6## 5 Adults 2020-10-03 approval 43.2## 6 Adults 2020-10-03 disapproval 52.6## 7 Voters 2020-10-03 approval 45.0## 8 Voters 2020-10-03 disapproval 51.7...20 / 23
Plot
ggplot(trump_longer, aes(x = date, y = rating_value, color = rating_type, group = rating_type)) + geom_line() + facet_wrap(~ subgroup)
21 / 23
ggplot(trump_longer, aes(x = date, y = rating_value, color = rating_type, group = rating_type)) + geom_line() + facet_wrap(~ subgroup) + scale_color_manual(values = c("darkgreen", "orange")) + labs( x = "Date", y = "Rating", color = NULL, title = "How (un)popular is Donald Trump?", subtitle = "Estimates based on polls of all adults and polls of likely/registered voters", caption = "Source: FiveThirtyEight modeling estimates" )

22 / 23
ggplot(trump_longer, aes(x = date, y = rating_value, color = rating_type, group = rating_type)) + geom_line() + facet_wrap(~ subgroup) + scale_color_manual(values = c("darkgreen", "orange")) + labs( x = "Date", y = "Rating", color = NULL, title = "How (un)popular is Donald Trump?", subtitle = "Estimates based on polls of all adults and polls of likely/registered voters", caption = "Source: FiveThirtyEight modeling estimates" ) + theme_minimal() + theme(legend.position = "bottom")

23 / 23


