library(tidyverse)
library(skimr)Hotel bookings - factors
# From TidyTuesday: https://github.com/rfordatascience/tidytuesday/blob/master/data/2020/2020-02-11/readme.md
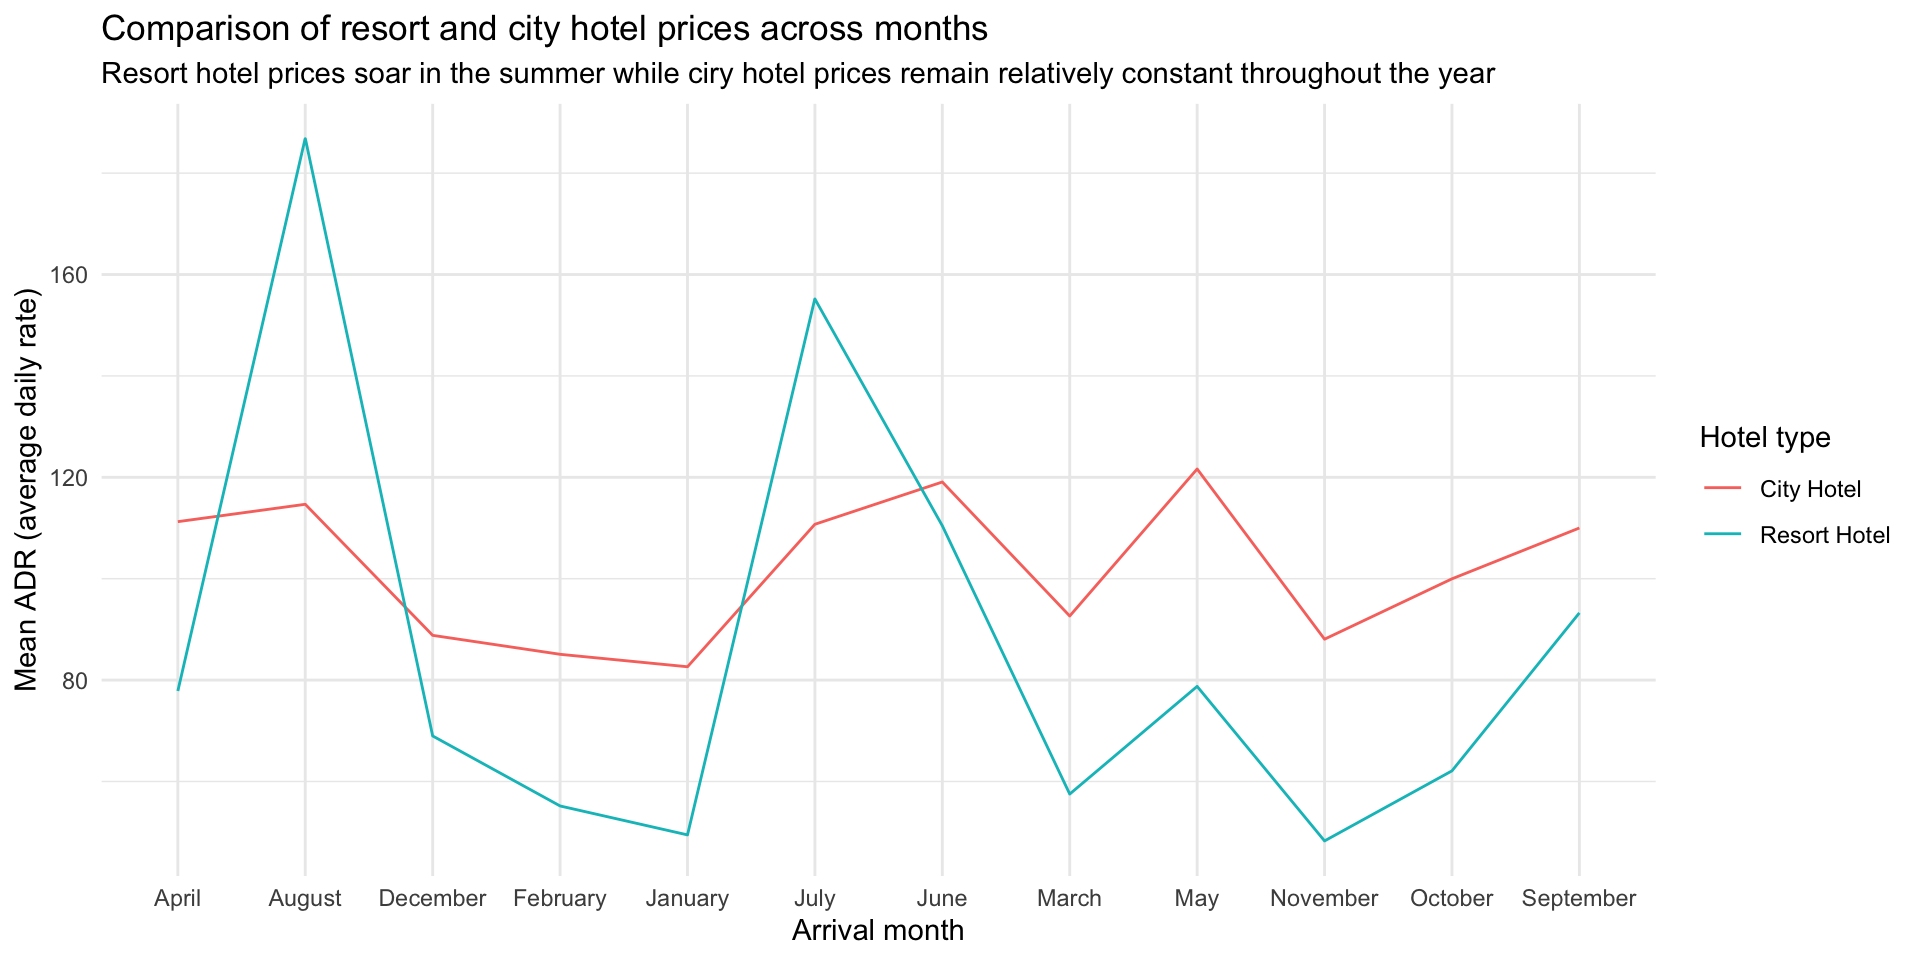
hotels <- read_csv("https://raw.githubusercontent.com/rfordatascience/tidytuesday/master/data/2020/2020-02-11/hotels.csv")First, knit the document and view the following visualisation. How are the months ordered? What would be a better order? Then, reorder the months on the x-axis (levels of arrival_date_month) in a way that makes more sense. You will want to use a function from the forcats package, see https://forcats.tidyverse.org/reference/index.html for inspiration and help.
Stretch goal: If you finish the above task before time is up, change the y-axis label so the values are shown with dollar signs, e.g. $80 instead of 80. You will want to use a function from the scales package, see https://scales.r-lib.org/reference/index.html for inspiration and help.
hotels %>%
  group_by(hotel, arrival_date_month) %>%   # group by hotel type and arrival month
  summarise(mean_adr = mean(adr)) %>%       # calculate mean adr for each group
  ggplot(aes(
    x = arrival_date_month,                 # x-axis = arrival_date_month
    y = mean_adr,                           # y-axis = mean_adr calculated above
    group = hotel,                          # group lines by hotel type
    color = hotel)                          # and color by hotel type
    ) +
  geom_line() +                             # use lines to represent data
  theme_minimal() +                         # use a minimal theme
  labs(
    x = "Arrival month",                 # customize labels
    y = "Mean ADR (average daily rate)",
    title = "Comparison of resort and city hotel prices across months",
    subtitle = "Resort hotel prices soar in the summer while ciry hotel prices remain relatively constant throughout the year",
    color = "Hotel type"
    )
`summarise()` has grouped output by 'hotel'. You can override using the
`.groups` argument.