library(tidyverse)
library(datasauRus)Lab 01 - Hello R
Load packages and data
Exercises
Exercise 1
Remove this text, and add your answer for Exercise 1 here.
Exercise 2
The answers for this Exercise are given for you below. But you should clean up some of the narrative so that it only includes what you want to turn in.
First let’s plot the data in the dino dataset:
dino_data <- datasaurus_dozen %>%
  filter(dataset == "dino")

ggplot(data = dino_data, mapping = aes(x = x, y = y)) +
  geom_point()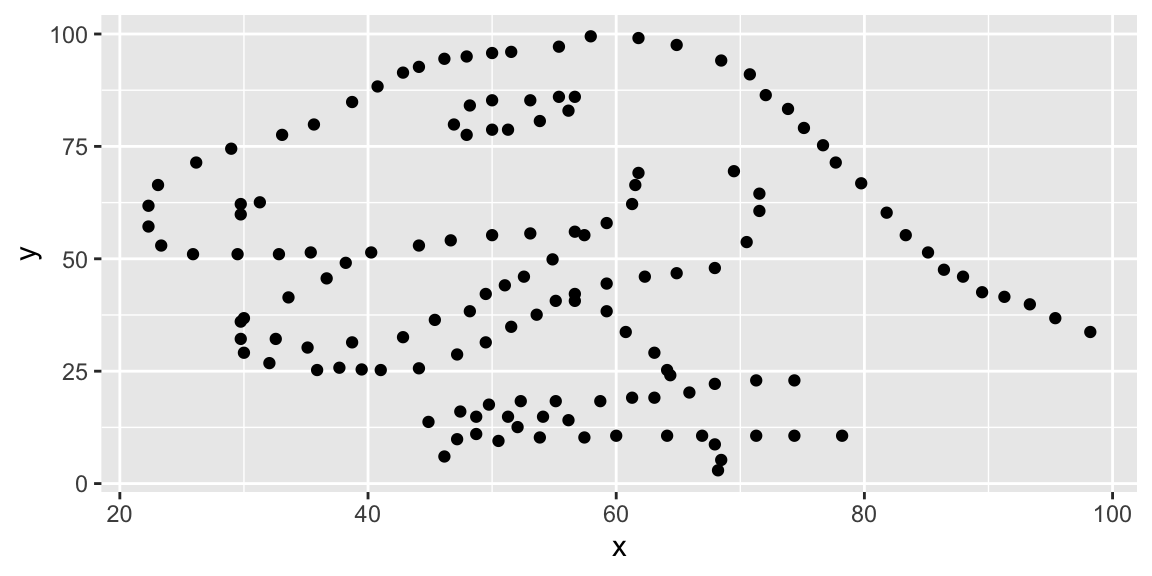
And next calculate the correlation between x and y in this dataset:
dino_data %>%
  summarize(r = cor(x, y))
# A tibble: 1 × 1
r
<dbl>
1 -0.0645Exercise 3
Add code and narrative as needed. Note that the R chunks are labelled with plot-star and cor-star to provide spaces to place the code for plotting and calculating the correlation coefficient. To finish, clean up the narrative by removing these instructions.
Blah blah blah…
I’m some text, you should replace me with more meaningful text…
Exercise 4
Add code and narrative as needed. Note that two R chunks are given but they are not labeled. Use the convention from above to name them appropriately.
Exercise 5
Add code and narrative as needed. To add R chunks either type out the backticks, curly braces, and the letter r or use the Insert chunk button above, green C+.